AI Is Taking the Next Dollar. SaaS Is Still Growing.
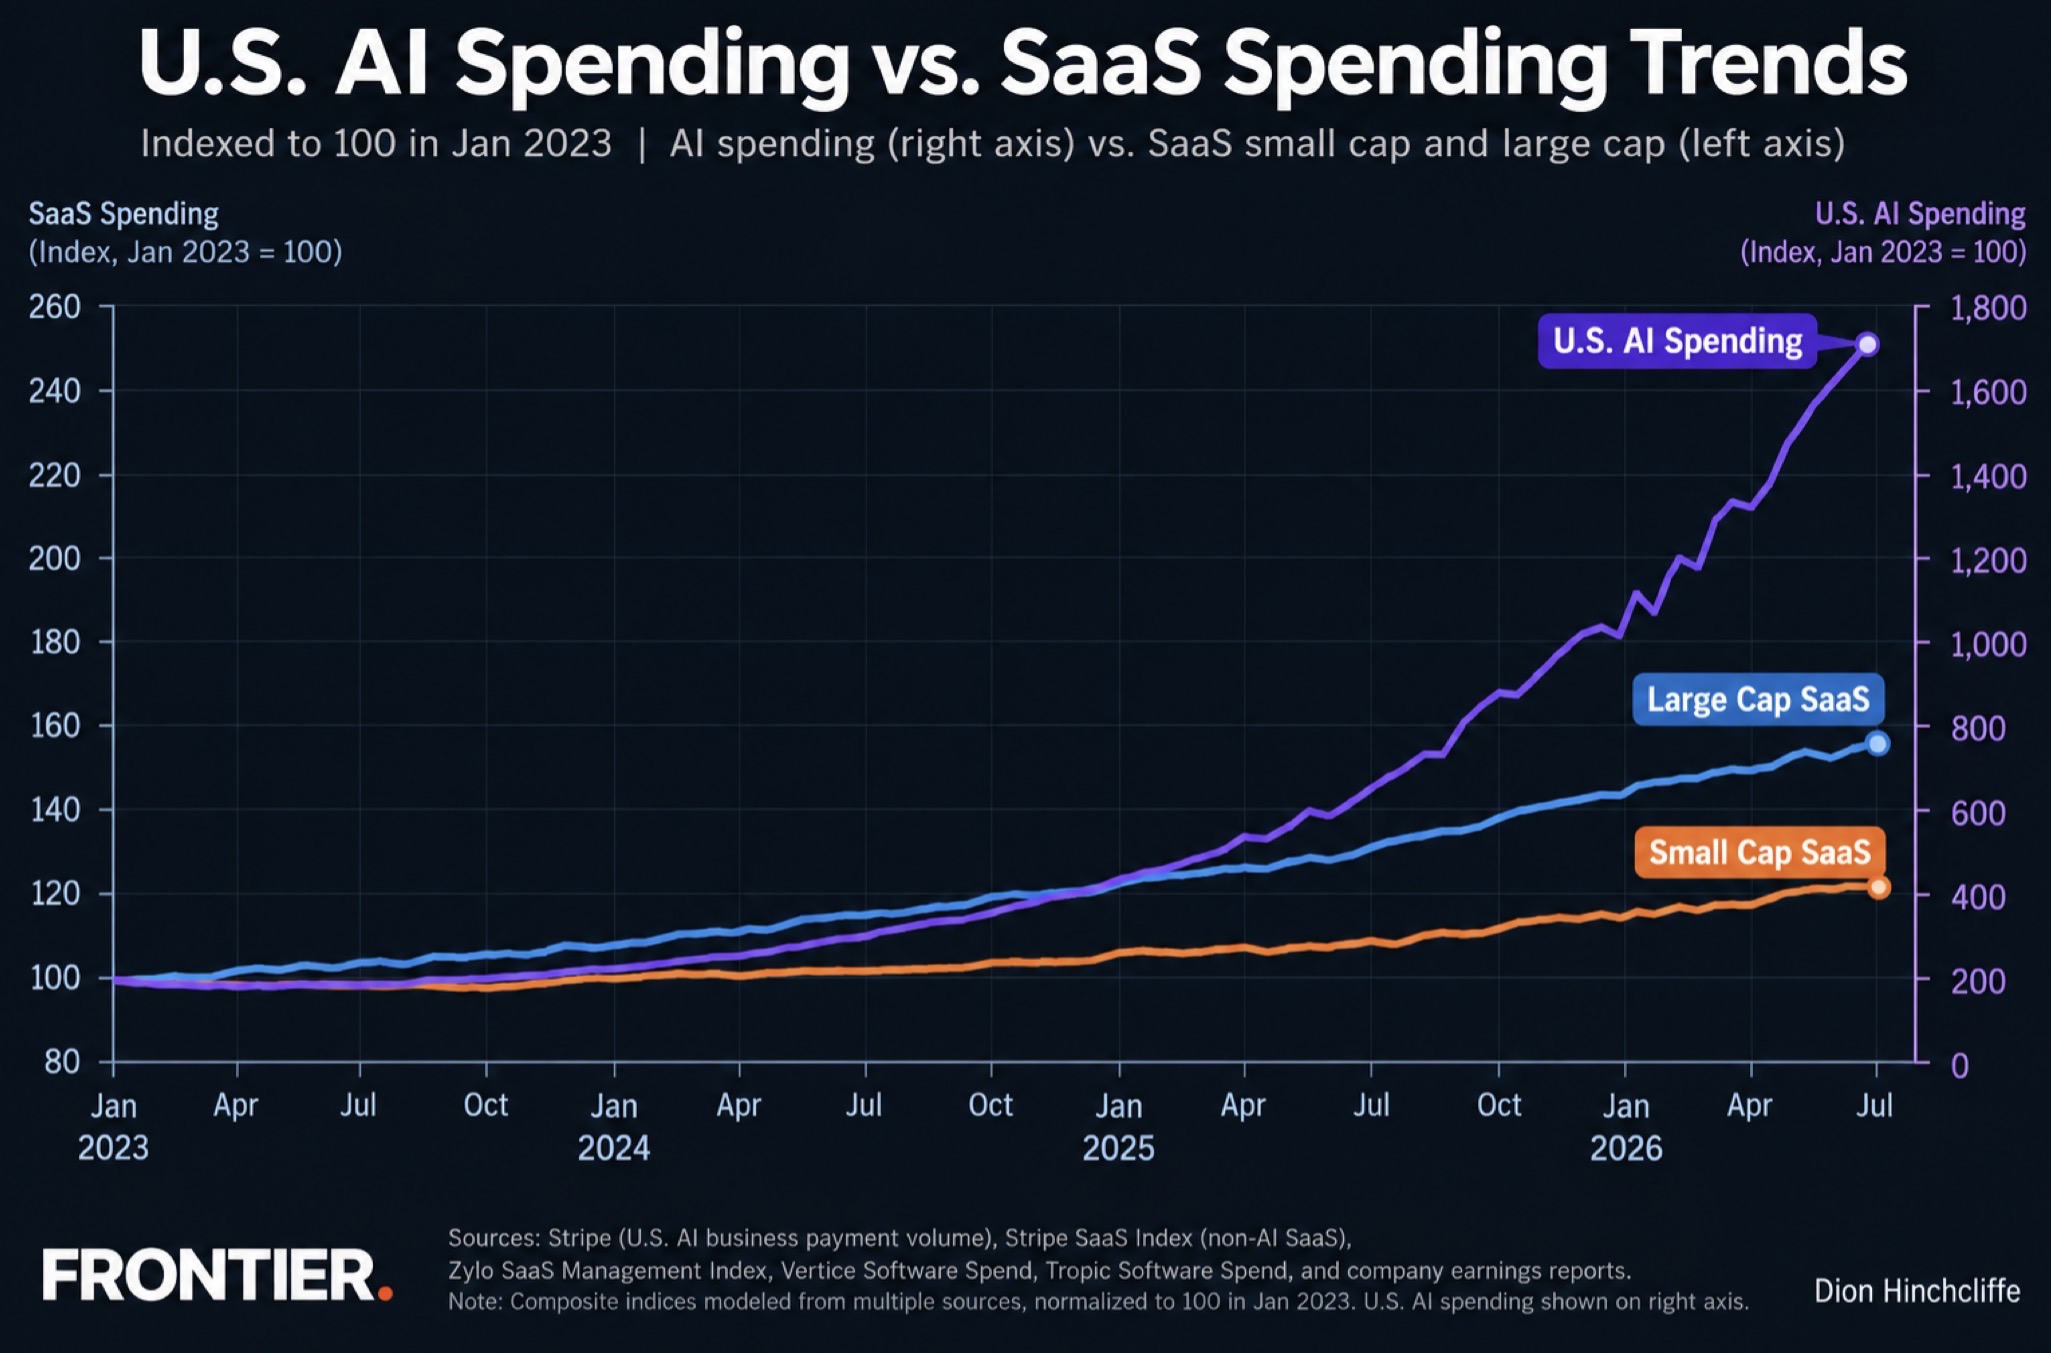
U.S. AI spending on Stripe is up 91% YoY while Frontier’s modeled SaaS composites remain positive. The first data point in the SaaSpocalypse story is divergence, not collapse.
The signal
| Reading | What it says |
|---|---|
| +91% | U.S. AI spending on Stripe, year over year.1 |
| +30.2% | Frontier modeled SaaS composite, July 2025 to July 2026. |
| ~3× | AI growth velocity versus the modeled SaaS composite. |
| 30M+ | Paid Microsoft 365 Copilot seats; M365 Commercial cloud revenue grew 14% while paid seats grew 6%.2 |
The useful signal is not that SaaS has escaped disruption. It is that AI is taking incremental software dollars much faster than SaaS is losing them. For now, the market looks more like a transfer of growth than a collapse.
ServiceNow reinforces the pattern: subscription revenue grew 24.5% year over year while its AI offerings crossed $1 billion in annual contract value.3 Salesforce reported Agentforce ARR above $1.5 billion and growth above 240% year over year.4 The incumbents are not standing still; they are trying to convert installed workflow distribution into AI monetization.
Read the chart this way
The chart above contains two different kinds of evidence. Stripe's 91% U.S. AI-spend growth is an observed source metric.1 The SaaS lines are Frontier modeled composite indices, normalized to 100 in January 2023. They are there to make the divergence visible, not to impersonate audited market totals.
In the model, the large-cap SaaS composite rises 32.9% from July 2025 to July 2026 and the small-cap composite rises 27.2%. Their simple composite rises 30.2%. Against Stripe's 91% AI-spend growth anchor, the strategic picture is stark: AI is growing at roughly three times the modeled SaaS rate while SaaS remains positive.
That is a different problem from a SaaS recession. It means the next dollar is moving before the last dollar disappears.
Explore the data
Launch the Frontier Data Field →
A draggable perspective view lets you inspect the modeled divergence, then flatten it when you want the numbers without the theater. The explorer reads the same artifact offered for download, so the visualization and machine-readable data stay synchronized.
Download the Frontier Data Object v0.1 →
The download is JSON-LD: source metrics, modeled observations, provenance, definitions, limitations, and the transformation assumptions travel together. It is intended to be immediately usable by humans, agents, notebooks, retrieval systems, and future Frontier research objects.
What this means for CIOs
- Track mix shift, not just software cuts. A flat SaaS budget can hide a rapid transfer from seats and workflow licenses into agents, inference, orchestration, data access and observability.
- Measure cost per accepted outcome. Seat counts and token costs are increasingly weak proxies for the economics of work. Track the fully loaded cost of a task that actually passes the business quality bar.
- Put renewal pressure where the value is only interface. Protect systems with unique data, regulated process depth and hard-to-replicate transaction rights. Challenge applications whose differentiation collapses into a workflow that an agent can reproduce.
Methodology / limits
The source metrics are reported values from the named companies and retain their original definitions. The time-series indices are Frontier modeled composites reconstructed from the original SaaS-vs-AI analysis and normalized to January 2023 = 100. They are not national spending totals, market-share estimates, or stock-price indices. Stripe measures activity on its own network, not the whole U.S. economy. Vendor ARR, ACV, revenue and seat metrics are not interchangeable.
The point is the shape of the transition: AI spending is accelerating dramatically while traditional software spending has not yet fallen off a cliff. The SaaSpocalypse, if it comes, is starting as a redistribution of growth. Not an extinction event.
[^stripe][^microsoft][^servicenow][^salesforce][^frontier-blog]